Introduction
The data dashboard maps out the curve so far - over 23.3 Million confirmed cases globally by the 4th week of August 2020, out of which about 806 thousand people have died. India has crossed 3.1 Million cases, still with relatively fewer death rate than in many other countries.1 We have undertaken 2000 CT scans of COVID positive patients during months of April to August 2020 and we observed a striking increase in CT severity score in patients who were admitted in months of July and August in comparison to the patients who were admitted in months of April to June. This may be attributed to different virus strains affecting the population at different times. Although strain and virulence is more of a Microbiological domain, yet Radiologically we could predict the severity of disease by HRCT thorax. This was sufficient to decipher that the population in this part of the world is affected differently, from month to month. We have attempted to analyse the HRCT thorax features, check the trend of severity over the duration of 5 months, from April to August and to correlate the CT severity score of patients with the clinical and laboratory parameters.
Materials and Methods
Population and methodology
A prospective study of 2000 consecutive cases were undertaken in Odisha COVID hospital KIMS, located in the Eastern part of India. Institutional Ethics committee clearance was taken for the research purpose. All the COVID positive cases who underwent HRCT thorax and laboratory investigations were included in the study. CT scans of COVID positive patients during months of April to August 2020 were selected. Patient selection was consecutive, and the solitary exclusion criterion was lack of HRCT either due to uncooperative patients or due to conditions like pregnancy, children below 6 years of age etc.
A dedicated 64 slices Seimens 'Somatom go.UP' CT scanner with SAFIRE technology was used, with slice thickness of 1mm, reconstructed to 0.5 mm & KV and mAs used were 130 and 100 respectively.
Imaging protocol
All patients, both symptomatic and asymptomatic, underwent HRCT thorax within 24 hours of admission. The number of days between the start of the symptom and the date of the original HRCT thorax has been tracked. For symptomatic patients If the time between the first clinical symptom and CT was <8 days, the patient was considered to have been imaged in the early phase of illness. If the time between symptom onset and CT was >8 days, the patient was considered to have been imaged in the late phase of illness.
CT severity score (CTSS) was calculated on the basis of the lobar involvement of the lung parenchyma, as under: (1) < 5%, (2) 5 - 25 % , (3) 26 - 50%, (4) 50 - 75 % , (5) > 75%. The cumulative CT score is the number of the individual lobar scores and will range from 0 (No involvement) to 25 (maximum involvement) when all five lobes have more than 75% involvement. Protocol followed in our COVID hospital for grading the severity of disease is asymptomatic, mild, moderate and severe is shown in Table 1.
Statistical analysis
Data were analyzed using statistical tools (Prism version 8.3, GraphPad Software). The prevalence of demographic and clinical features of populations was expressed as the number (percentage) of occurrences. Pearsons Correlation Test was used for associations between CTSS and laboratory results. (CRP, ESR, D-Dimer, WBC count, Lymphocte count and procalcitonin). A p-Value of <0.05 was considered as significant.
Table 1
Protocol followed in our dedicated COVID hospital to categorise patients as Asymptomatic, mild, moderate and severe.
Table 2
Clinical and HRCT results of study population (n =2000)
Figure 1
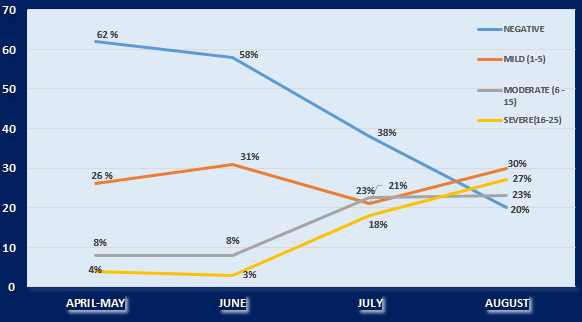
Increasing trend of disease severity in eastern India population.
X- Axis denotes time period in months.
Y- Axis denotes patient population in percentage.
Mild, Moderate and severe categories divided on the basis of CT severity score as 1-5, 6-15 and 16-25 respectively.

Table 3
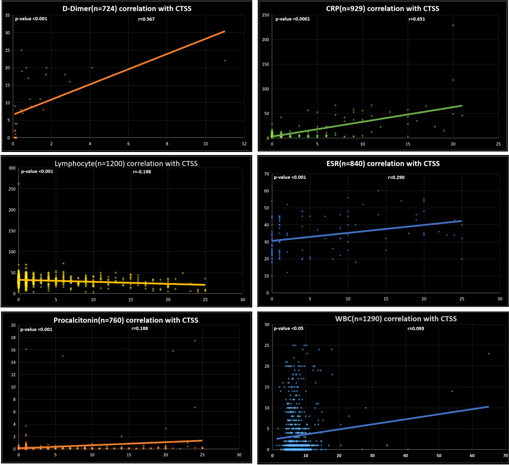
CTSS correlation with different biomarkers on the basis of pearsons correlation analysis
Figure 2
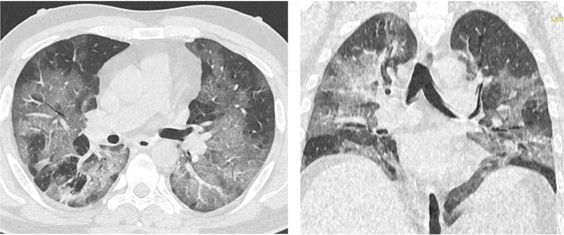
Axial and coronal sections of CT showed diffuse Ground glass opacification with areas of 'Crazy Paving' indicating towards the late phase of disease.
A 49 years old male presented with fever, dry cough and breathlessness since 8 days. Patient was shifted to ICU as he was tachypnoeic, was intubated and kept on mechanical ventilation. CT severity score was 20/25. Biochemical profile showed increased CRP (229 mg/L) and D-Dimer (2.19 µg/ml) levels. Patient was classified as severely ill and declared dead on 21st day of illness.

Figure 3
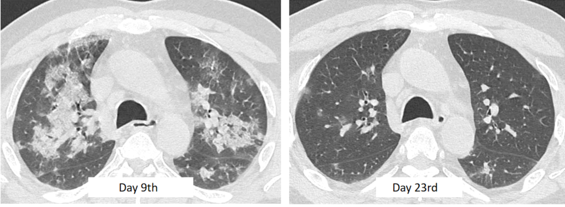
Progressive improvement in patient’s condition after aggressive medical treatment as predicted on HRCT Thorax.
51 years old COVID-19 positive male patient admitted with complaints of intermittent fever, myalgia and shortness of breath since 8 days. Initial HRCT thorax scan was done on 9th day of illness revealed multiple areas of Ground glass opacifications (GGOs) and consolidation with CT severity score (CTSS) of 14/25. Patient was kept on aggressive conservative management. Patient’s condition improved gradually and fever subsided. A repeat HRCT scan on 23rd day showed significant resolution of GGOs and Consolidation with CTSS of < 5.

Results
Clinical results
In our study group most of patients were in third and fourth decades with mean age 37.5 years. Bulk of the patients (88%) constituted the age group of 19-59 years. Paediatric (<18 years) and elderly patients (>60 years) comprised of 5% and 7% of total population respectively. Females patients (n=512, 25.6%) were lesser than males (n=1488, 74.4%) with an average sex ratio, Male: Female being 2.8:1 in this study.
Out of total analyzed patients, 880 patients (44%) were without any clinical signs and symptoms (asymptomatic) while 1120 patients (56%) were symptomatic. In symptomatic patients, fever (663/1120, 59.2%), cough (452/1120, 40.4%), shortness of breath (319/1120, 28.5%) and sore throat (176/1120, 15.7%) were the most common presenting clinical manifestations while a few patients also had other symptoms (85/1120, 7.5%) like headache, chest pain, pain abdomen, altered sensorium etc. (Table 2).
32% patients had co-morbidity like Diabetes mellitus (21.75%) & chronic Renal disease (6.6%). In addition there was hypertension (16.25%), coronary artery disease (4.95%) and other disease like hypothyroidism, anemia, chronic obstructive pulmonary disease, in few (4.5%).
HRCT analysis
Out of 2000 COVID positive patients 1220 (61%) patients were found to be radiologically positive on HRCT chest imaging while 780 patients (39%) had normal CT findings. The lung pathological changes were evaluated according to HRCT imaging severity score, and we found Typical COVID findings in 630 patients (31.5), Indeterminate in 290 patients (14.5%), Atypical in 300 patients (15%) and 780 (39%) patients had normal CT chest findings.
Symptomatic clinical presentation were higher (84.7%) in patients who had Typical COVID-19 findings on CT imaging while it was lower in indeterminate (59.4%) and atypical CT findings (64%). Out of total Covid positive patients (n=2000), 780 patients (39%) were found to be in normal category, 490 patients with CTSS 1 to 5 accounted for 24.5% while patients having CTSS between 6 to 15 (384 patients) and between 16 to 25 (346 patients) accounted for 19.2% and 17.3% respectively.
HRCT chest of our study population showed variety of opacity characteristics. Out of 1220 Radiologically positive patients, 866 patients (71%) had isolated Ground glass opacities (GGO) while another 268 patients (22%) had both GGO and consolidation and only 86 patients (7%) had isolated consolidation. Among all Radiologically positive patients, CT chest imaging also showed some specific findings which includes pleural effusion in 67/1220 patients (5.4%), pulmonary nodules in 270/1120 patients (22.1%), thoracic lymphadenopathy in 120/1220 patients (9.8%) and cavitatory lesions in 12/1220 patients (0.98%). Pneumomediastinum was seen in 2/1220 patients.
Among all Radiologically positive patients, HRCT chest had different lobar distribution of opacities in which 317/1220 patients (26%) had only one lobe affection, 390/1220 patients (32%) had two lobes affection, 134/1220 patients (11%) had three lobes affection, 146/1220 patients (12%) had four lobes affection and 233/1220 patients (19%) had all five lobes affection. Out of total Radiological affected 1220 patients, average 68.6% patients had predominant lower lobe involvement while 26% patients had both upper and lower lobe involvement and only 5.4% showed upper lobe predominance.
HRCT chest of study population had variable axial distribution of opacities, among them 625 patients (68.3%) had peripheral distribution, 225 patients (24.5%) had both central and peripheral distribution while only 65 patients (7.1%) showed solitary central distribution.
Graphical representation of increased severity trend has been shown in Figure 1
CT patterns in early versus late-phase disease
In our study population CT chest done at various phase of disease. In this scenario, Out of 1220 Radiologcally positive patients, 835 patients (68.4%) were found to be in early phase (<8 days of illness) and 385 patients (31.6%) in late phase (>8 days of illness) of disease progression. Out of 835 patients In early phase of disease 80% patients had GGO while remaining 20% had both GGO and consolidation. Out of 385 patients In late phase of disease, 57% patients had GGO, 24.3% patients had both GGO and consolidation while remaining 18.7% patients had only consolidation.
GGO patterns were significantly prevalent in early-stage disease compared to late-stage disease, while crazy paving and consolidation forms were significantly more prevalent in late-stage disease (Figure 2). As far as CT-related features are concerned, subpleural curvelinear lines were considerably common in the early phase, while fibrosis was prevalent in the late phase. No major variations were noted for reverse halo sign, pleural effusion, nodules, and lymphadenopathy between early-and late-phase effusion.
Compared with the disease phase, the CT score was observed to be slightly higher in late-phase patients than in early-phase patients (p < 0.0001).
Analysis of CT staging with duration of hospital stay and mortality
Of the 2000 patients in the sample, 62 (3.1%) died during an average follow-up of 14.2 ± 4 days (range 1–24 days), 49 of which exhibited at least one or more of those mentioned comorbidities. Mortality was higher in patients ≥ 60 years of age (n=33/62; 53.3 %) than in patients < 60 years of age (n=29/62; 46.7 %) (p < 0.003), with a mean age of 51 years.
The average duration of stay in hospital was found to be 12 days (Range 9 to 24 days). Patients with CTSS of Zero (780/2000, 39%) and CTSS of 1 to 5 (490/2000, 24.5%) had less mean duration of stay (10 days) and did not require any active management. Patients with CTSS of 5 to 15 (n= 384/2000, 19.2%) were having mean duration of 13 days, most of them were recovered after proper management (Figure 3). Patients with CTSS >15 (n= 346/2000, 17.3) were categorised as severely ill patients with relatively higher mortality of 32.9% (54 deaths out of 346 patients). These patients were kept in ICU.
Correlation of CTSS with laboratory markers like D-Dimer, CRP, ESR, Procalcitonin, WBC count and Lymphocyte count is shown in Table 3. p Value was calculated and Pearsons correlation method was used to find the correlation coefficient (r).
Discussion
Our hypothesis was that CT analysis of disease progression with clinical and laboratory analysis may be helpful in assessing the severity of corona virus in the population of Eastern India. Around 39% of the scans of COVID positive patients were normal. As anticipated, CT scores were substantially lower in the mild group than in the severe and critical categories, suggesting a high association between imaging results and clinical stages.
Previously, it has been reported that approximately 50 percent of patients were confirmed to have elevated D-dimer levels and high D-dimer rates were correlated with poor prognosis.2, 3 We analysed correlation of D-Dimer with CTSS score in 724 patients and found that there was moderate positive correlation (r = 0.56) between D-dimer levels and CTSS (Table 3 Figure 4) with a p value of <0.001 and hence D-Dimer values can be considered as supporting biomarker in determining the severity of the disease. Among the dead patients, 60% cases had D-Dimer increased, two times higher (>1.10 mcg/mL).
Pearsons correlation statistical analysis was performed on C-reactive protein level and CTSS in 929 patients with results of Pearsons correlation coefficient (r) = 0.65 and p value of < 0.0001 indicating moderately positive significant correlation between the CRP levels and CTSS (Table 3 Figure 4); therefore, It can be considered a useful predictor when determining the symptoms of the patient along with other clinical results. CRP levels were found to be increased in 74% cases with mean CRP levels of 78 mg/L (Range 24 -223 mg/L) among the total deaths. In few descriptive studies, Procalcitonin has now been seen to be an important useful method for early detection of patients at low risk of bacterial coinfection in the ongoing COVID-19 pandemic.4, 5 Pearson’s correlation statistical analysis was performed on procalcitonin in 760 patients and study showed small positive correlation (Pearson’s coefficient, r = 0.18) between procalcitonin and CTSS (Table 3 and Figure 4). Similarly, correlation of ESR with CTSS was done in 840 patients and it was found to be, r = 0.29 (Table-3 and Fig-4). This observation suggests mild positive correlation of procalcitonin and ESR in determining the severity of COVID, but since the correlation is mild, both cannot be considered as reliable markers of the severity. Correlation between lymphocyte count and CTSS was also made and Pearsons coefficient (r) was found to be -0.2 (Table 3 and Figure 4), showing small negative correlation suggesting that considerable proportion of patients of COVID may show lymphopenia.
We have analysed the month wise severity of COVID in our population and found a trend of increasing severity in months of July and August as compared to months of April to June. In April-May the proportion of patient having CTSS 16-25 was just 4% which had increased to 27% in month of August. Similarly, the proportion of patients having normal scans fall down considerably during these months as shown in Figure 1. The sudden change in trend of severity could be attributed to the migrants labourers, domestic & international travellers, who came back post lockdown. Our assumption was that this category of patients could have been infected by more virulent viral strain.
The main feature of COVID-19 pneumonia, as stated in our study, is the incidence of bilateral GGOs with or without consolidated areas, with prevalent peripheral, lower lobe and posterior anatomical distribution.6, 7, 8, 9 The prevalence of GGOs in our case series in the early stages of the disease is likely to indicate the imaging association of acute-phase diffuse alveolar dysfunction found with airspace edema, bronchiolar fibrin, and interstitial thickening.10 Late illness develops with the stimulation of humoral and cellular defenses mediated by virus-specific B and T cells, causing an abnormal release of pro-inflammatory cytokines that may induce unregulated autoimmune reactions. These results that explain the higher prevalence of crazy-paving trends and consolidation areas that we have seen in our late disease population, are likely to be related with a combination of alveolar edema, bacterial superinfection, and interstitial inflammatory changes.11
The 62 patients who died, 54 ( 87%) had CTSS of > 15. Among the dead patients, the prevalence of one or more comorbidities was significantly higher in 49patients (79%). It was obvious that patients having CTSS more than 15, higher D-Dimer and CRP values are more prone to death. Similar findings have recently been documented by Colombi et al 12, who observed a strong association between the degree of CT lung involvement and ICU admission or mortality in a cohort of 236 patients.
There are certain limitations of this study. We had taken only Clinico-Radiological parameters into consideration, while mortality and morbidity also depends on epidemiology, medical facilities, government measures and different strains of virus which vary among regions and countries.
Conclusion
We tried to analyse the CT parenchymal involvement pattern in the patients admitted to our hospital and found that majority of patients (63.5%) showed either normal CT scan (39%) or mild involvement of lung fields as represented by CTSS of <5 (24.5%). We observed increasing trends of severity as the months passed from April to August.
Most of the deaths in our cohort were associated with preexisting comorbidities suggesting that the COVID was not the sole cause of these deaths. CT scoring could help to stratify patient’s risk and predict short-term outcome of patients with COVID-19 pneumonia. The extent of CT damage is highly correlated with various parameters of disease, including clinical staging. D-dimer and CRP correlates well with the CTSS and hence both can be used as a monitoring tool to keep an eye on the severity and progression of disease.
The mortality in our cohort was very low and this might be attributed to the standard protocols followed for each patient admitted in our dedicated COVID hospital and hence, we recommend the protocol given in Table 1 for the proper management of the patients suffering from COVID-19.

